New map reveals an altered landscape for growers
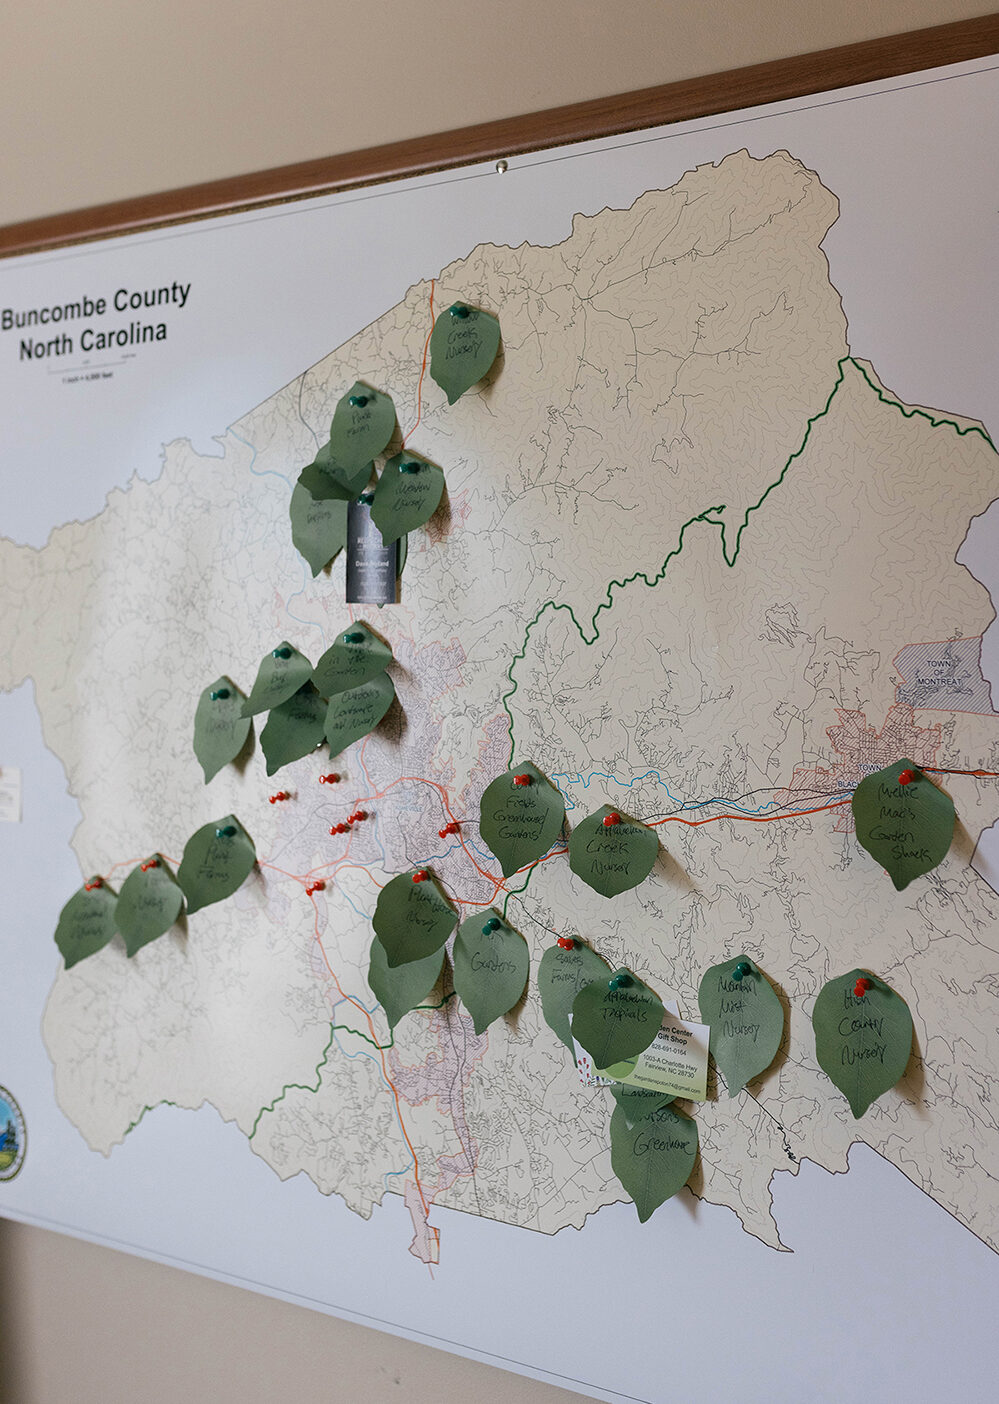
The hardiness map is divided into microclimates.
Photo by Rachel Pressley
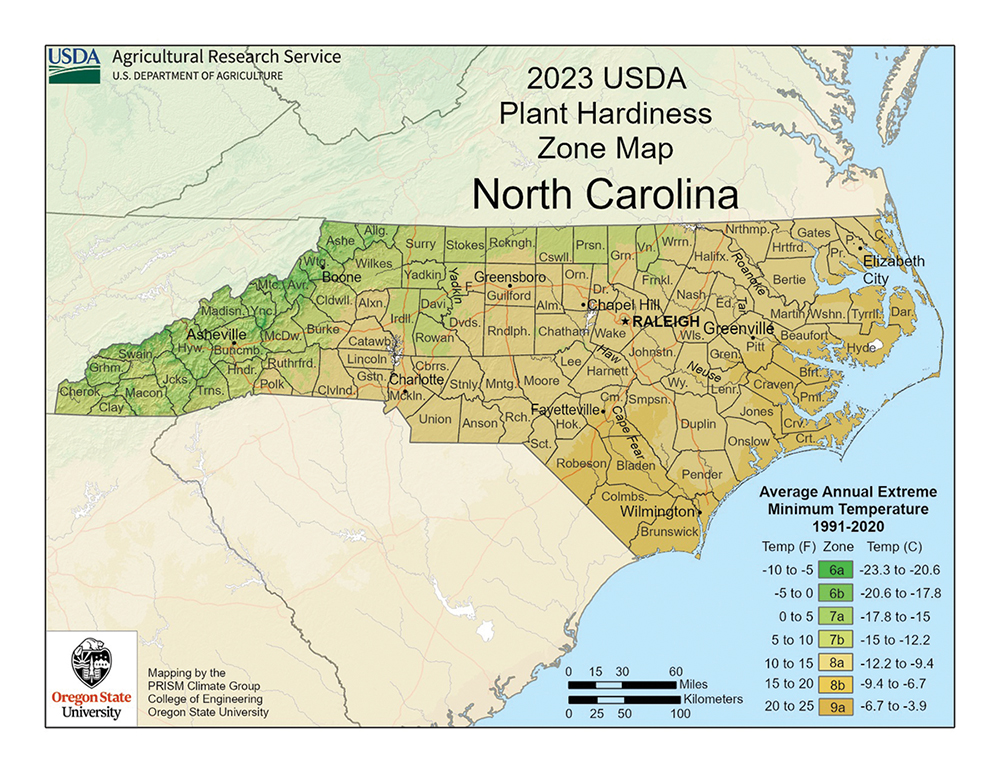
Late last year, the USDA released an updated Hardiness Zone Map, its first in over a decade. The product of massive data crunching, the latest map provides useful information for gardeners and growers. Dividing the U.S. into 13 zones and subzones, from arctic to tropic, the map helps with decisions about planting.
For the first time since Hardiness Zone maps were recorded, Western North Carolina now lies predominantly in zones 7a and 7b, instead of 6a and 6b, cooler zones that historically reach northward to the Great Lakes. (Some areas of WNC still fall in 6a and 6b, but those areas are smaller now.)
Buncombe County Horticultural Extension Agent Luke Owen spoke with Carolina Home + Garden about the implications.
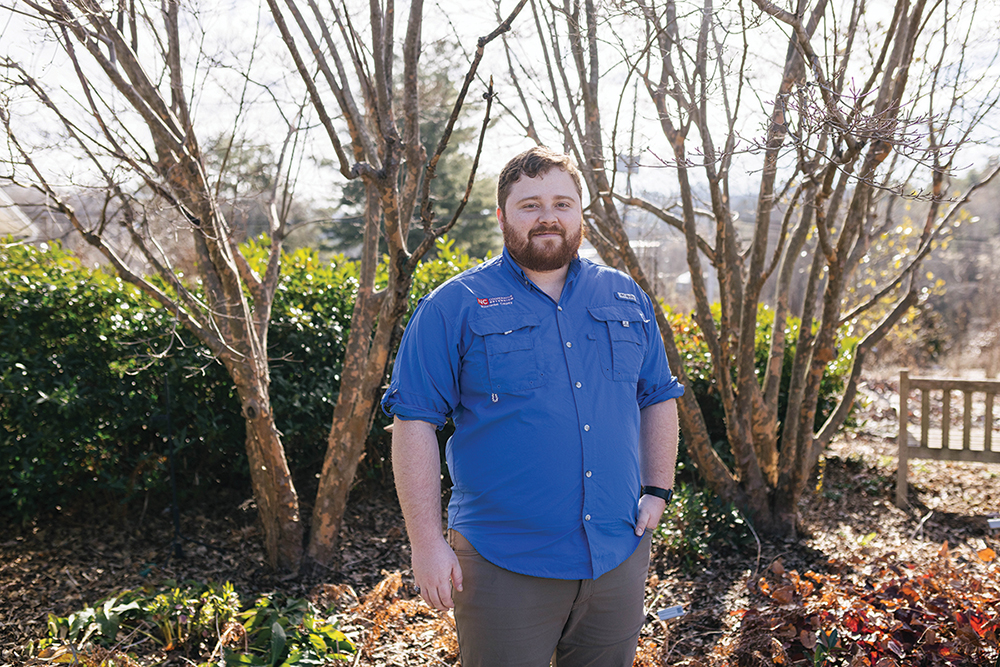
“It’s hard to argue with 30 years of data,” says Horticultural Extension Agent Luke Owen.
Photo by Rachel Pressley
How is this map — built upon data and technology — a useful tool for the home gardener?
The degree of accuracy is incredible. Growers, residential landowners, and gardeners are benefitting from the specific nature of that modeling. Now we can determine more accurately things that we’re observing in the landscape: declines of certain plant populations, as well as plants that are surviving now that were not able to survive ten years ago.
The new map has compiled a wealth of data from weather stations all over the country. How region-specific is the information?
The resolution can get exactly to your ZIP code. They’ve been able to take in factors that they weren’t able to factor in before, including topography and elevation changes. If you type in your address, it will zoom in to that; you can actually see some resolution lines all the way down to your address.
The new map demonstrates a continued northward movement of the zones, in line with climate-change trends. Is this at all controversial?
It’s hard to argue with aggregates of data that have been compiled over 30 years’ time. We can agree to disagree about how to address climate change in terms of policy, but in terms of actually recognizing that shift, this is something that we’ve been monitoring for years. With this Hardiness Zone map, our area has seen a general increase in about a half a zone of hardiness. And that’s proving what we’ve seen in these keystone examples of climate in action.
With the Hardiness Zones shifting northward, what are some plant species that are no longer doing as well in our region?
The species Picea pungens, or Colorado Blue Spruce, is now on the decline; our summer average temperatures over the last ten years have led to a decrease in overall health of these trees. Other plants that might have a more difficult time in our zone include lilacs and some important fruiting cultivars, including certain varietals of apples.
On the upside, are there plants and crops that are now becoming viable in our zone?
There are plants that I see now, like edgeworthia [“paper bush”] and other ornamentals, that we can actually enjoy in our landscape; we weren’t able to do so not that long ago.
From a vegetable-and-fruit standpoint, I’m seeing hardy kiwis, loquat, and citrus species that — if planted in the right areas — can thrive in our zone. It’s not like we’re going to see orchards of citrus in the future, but if you have the right microclimate, you can push that envelope. Other push-the-envelope plants include Meyer Lemon Tree, Japanese Aralia, and Hardy Banana [Tree].
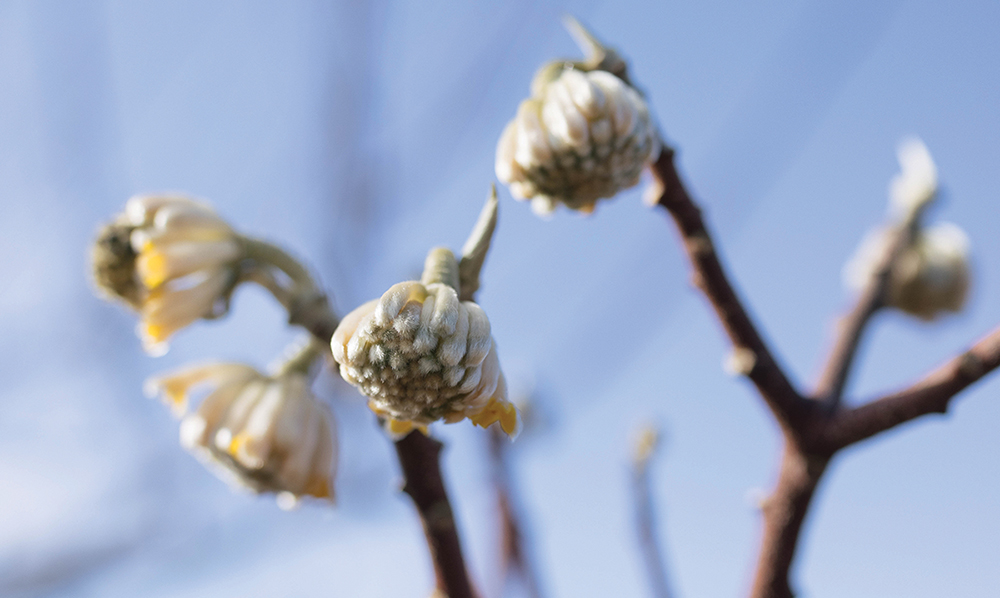
Photo by Rachel Pressley
Big picture, what does the data mean for you and your colleagues at the Extension Service?
The conversation that we should be having now is: How does this impact our established agriculture industries and our landscapes? We have got to get ahead, protecting and working for those constituents who rely on agriculture for their living. This means breeding programs are now selecting for more heat tolerance in our ornamental landscape plants, as well as apple cultivars that perhaps have lower chilling-hour requirements to maintain a good fruit set.
What conclusions can local home gardeners draw from the new data?
The map itself is just a tool that’s being used to showcase what we’re already seeing in the landscape. So nothing has changed overnight. However, it does put things in terms that are clear to understand: There are plants that were once not able to thrive in our landscape, and now gardeners might be able to try something new in their flowering garden or vegetable garden.
In terms of management and proper planting, all of the best practices still apply. You can’t control the weather. We’re just trying to manage what we can control, such as plant selection; for everything else, we just do the best we can.
The USA’s Hardiness Zone Map is online at planthardiness.ars.usda.gov